Measurement Marketing Audits
What We do
I consult and am available by select hire revolving around Data Auditing, Architecture, Visualization, Optimization, and ultimately, Analysis.
I have a strong background and experiences in data analysis, digital analytics, measurement protocol, and use my Development skills with languages such as SQL, R, and Javascript to be a truly data-driven Marketer.

A few programs I’m highly proficient in, but not limited to are:


Lucidchart
Google Analytics

Google Tag Manager
Google Sheets
Google BigQuery
Google Data Studio

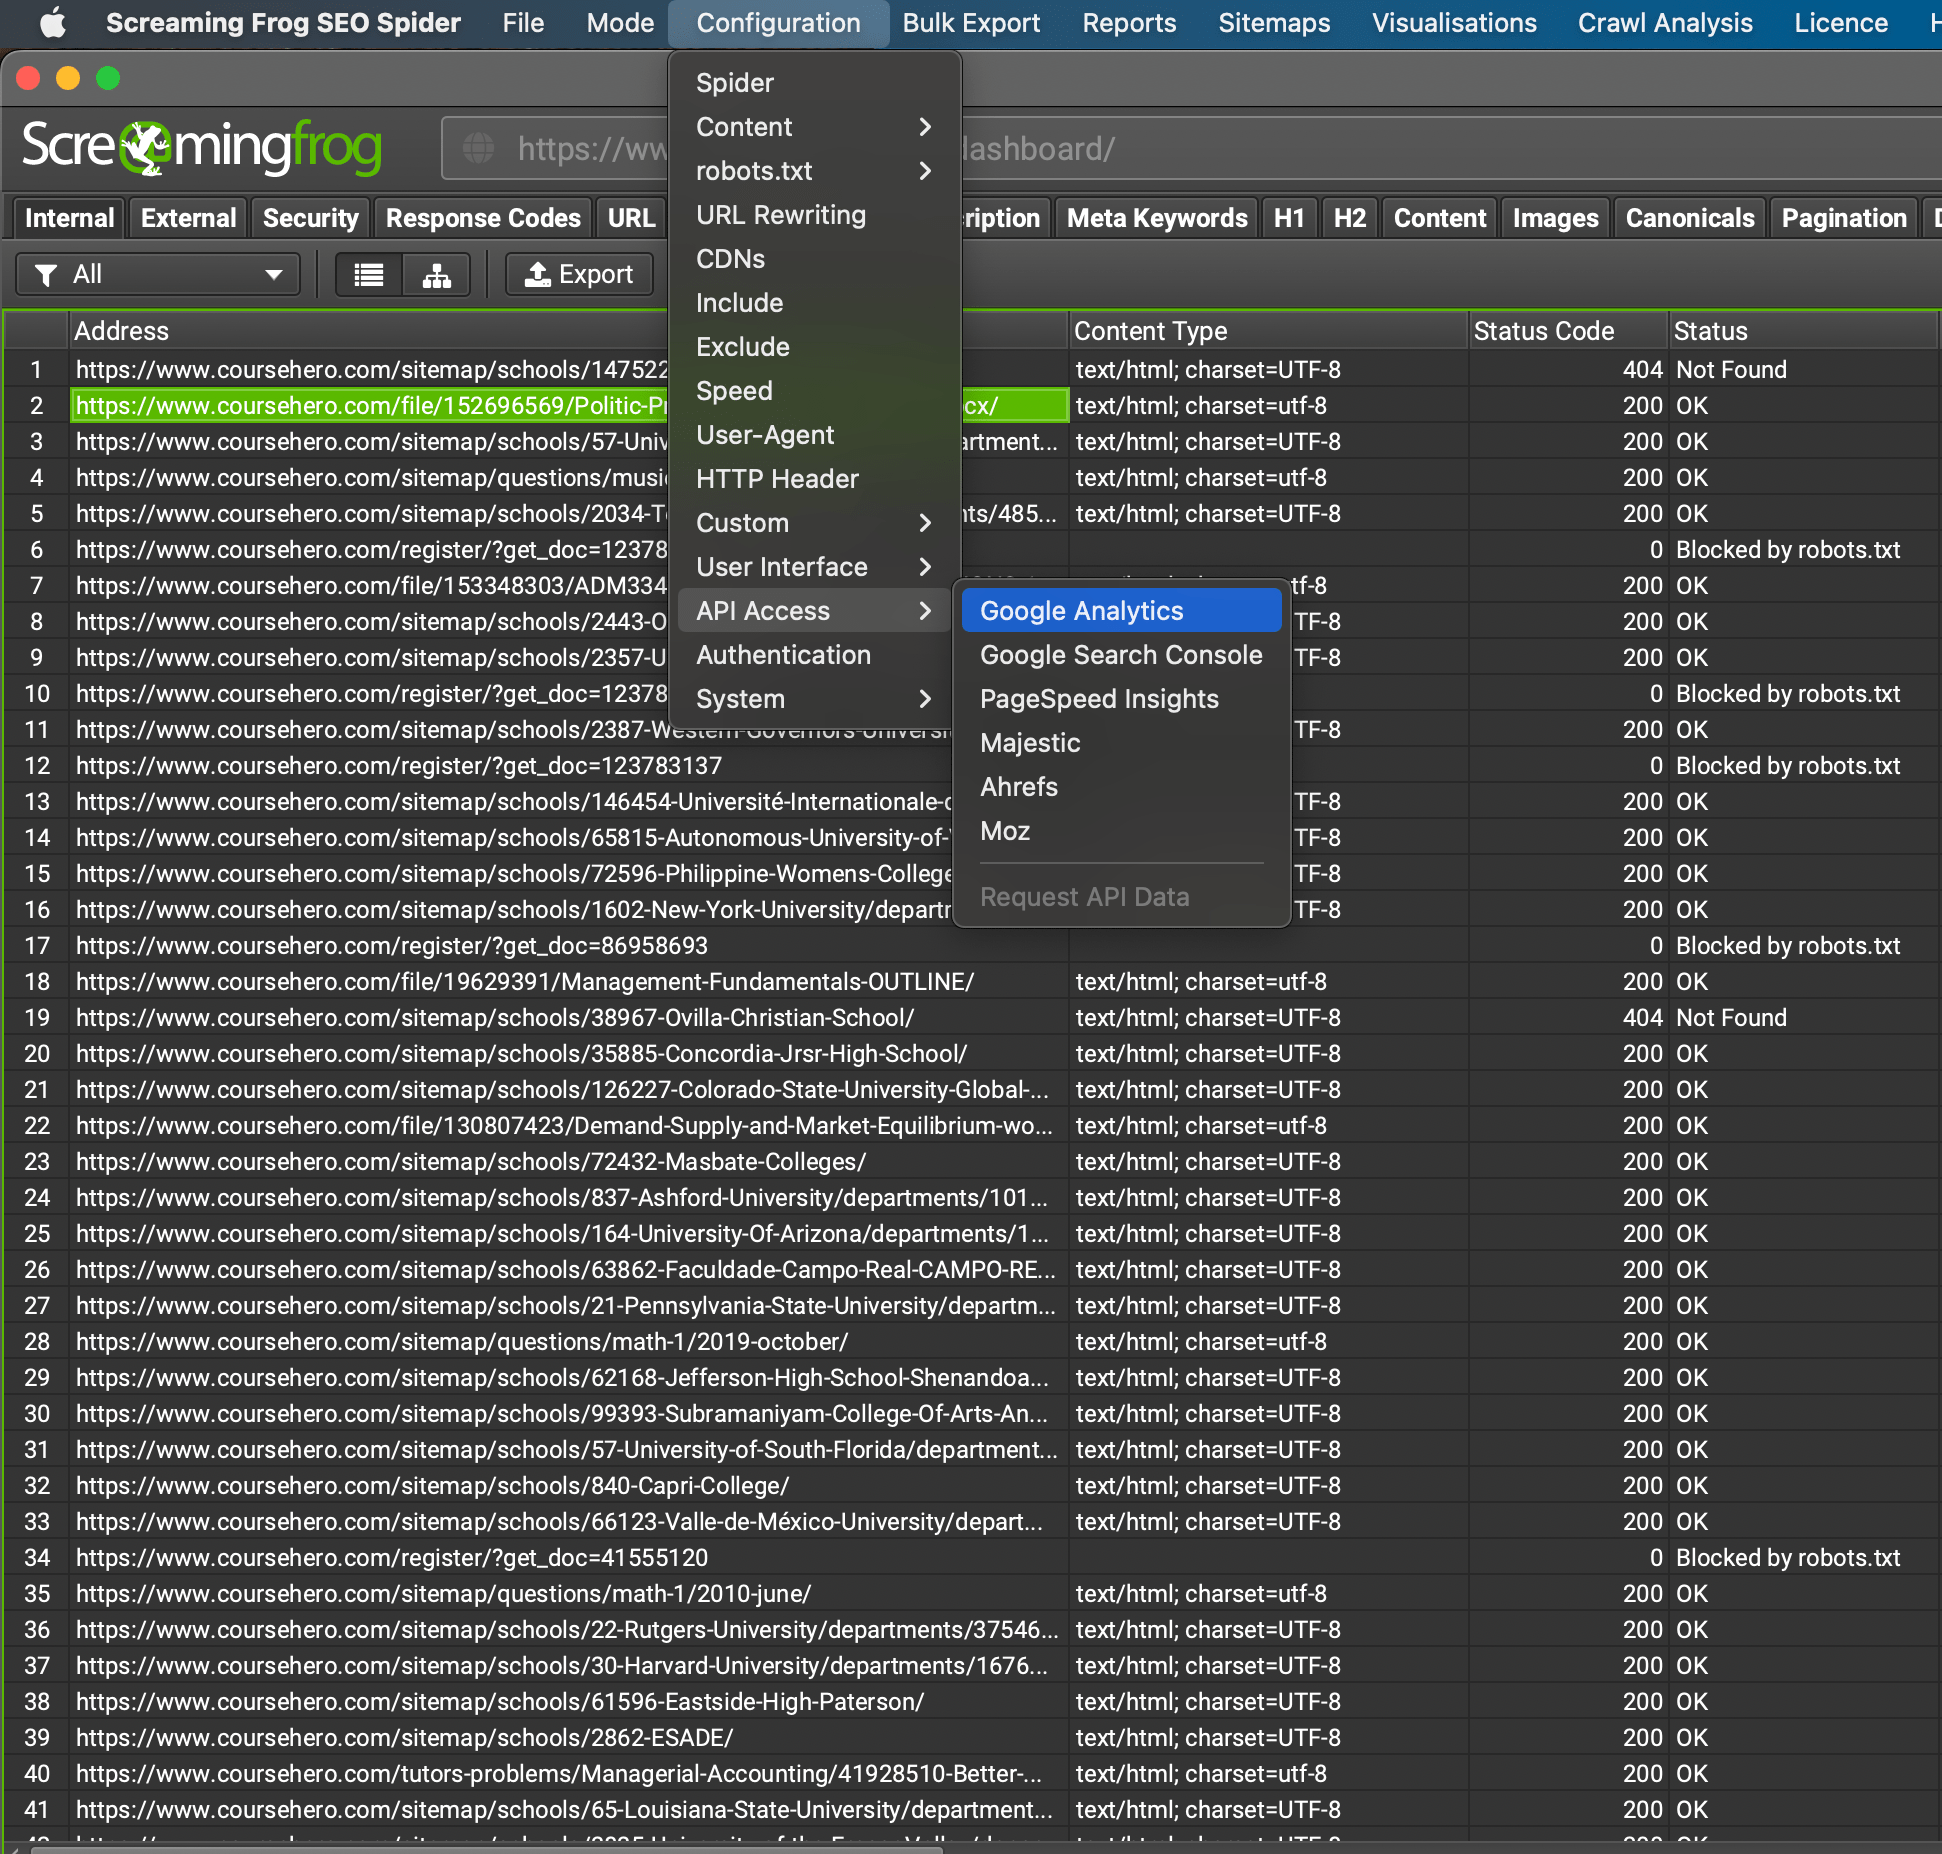
ScreamingFrog

Frogs be screaming...
Screaming Frog is such an underrated tool. If you don’t know about this and are in Marketing, you should.
We start here, because rule #1, don’t assume the client knows (or told us) everything…I mean, you hired us for a reason…
…and we want to not only make sure we’re thinking through content grouping effectively…
…but also that we don’t find any URLs missing the GTM script.
This is our way of getting as close to the root of your site as possible to TBV (trust but verify)where everything is

Reporting
Lorem Ipsum has been the industry's standard dummy text

Company Growth
Lorem Ipsum has been the industry's standard dummy text
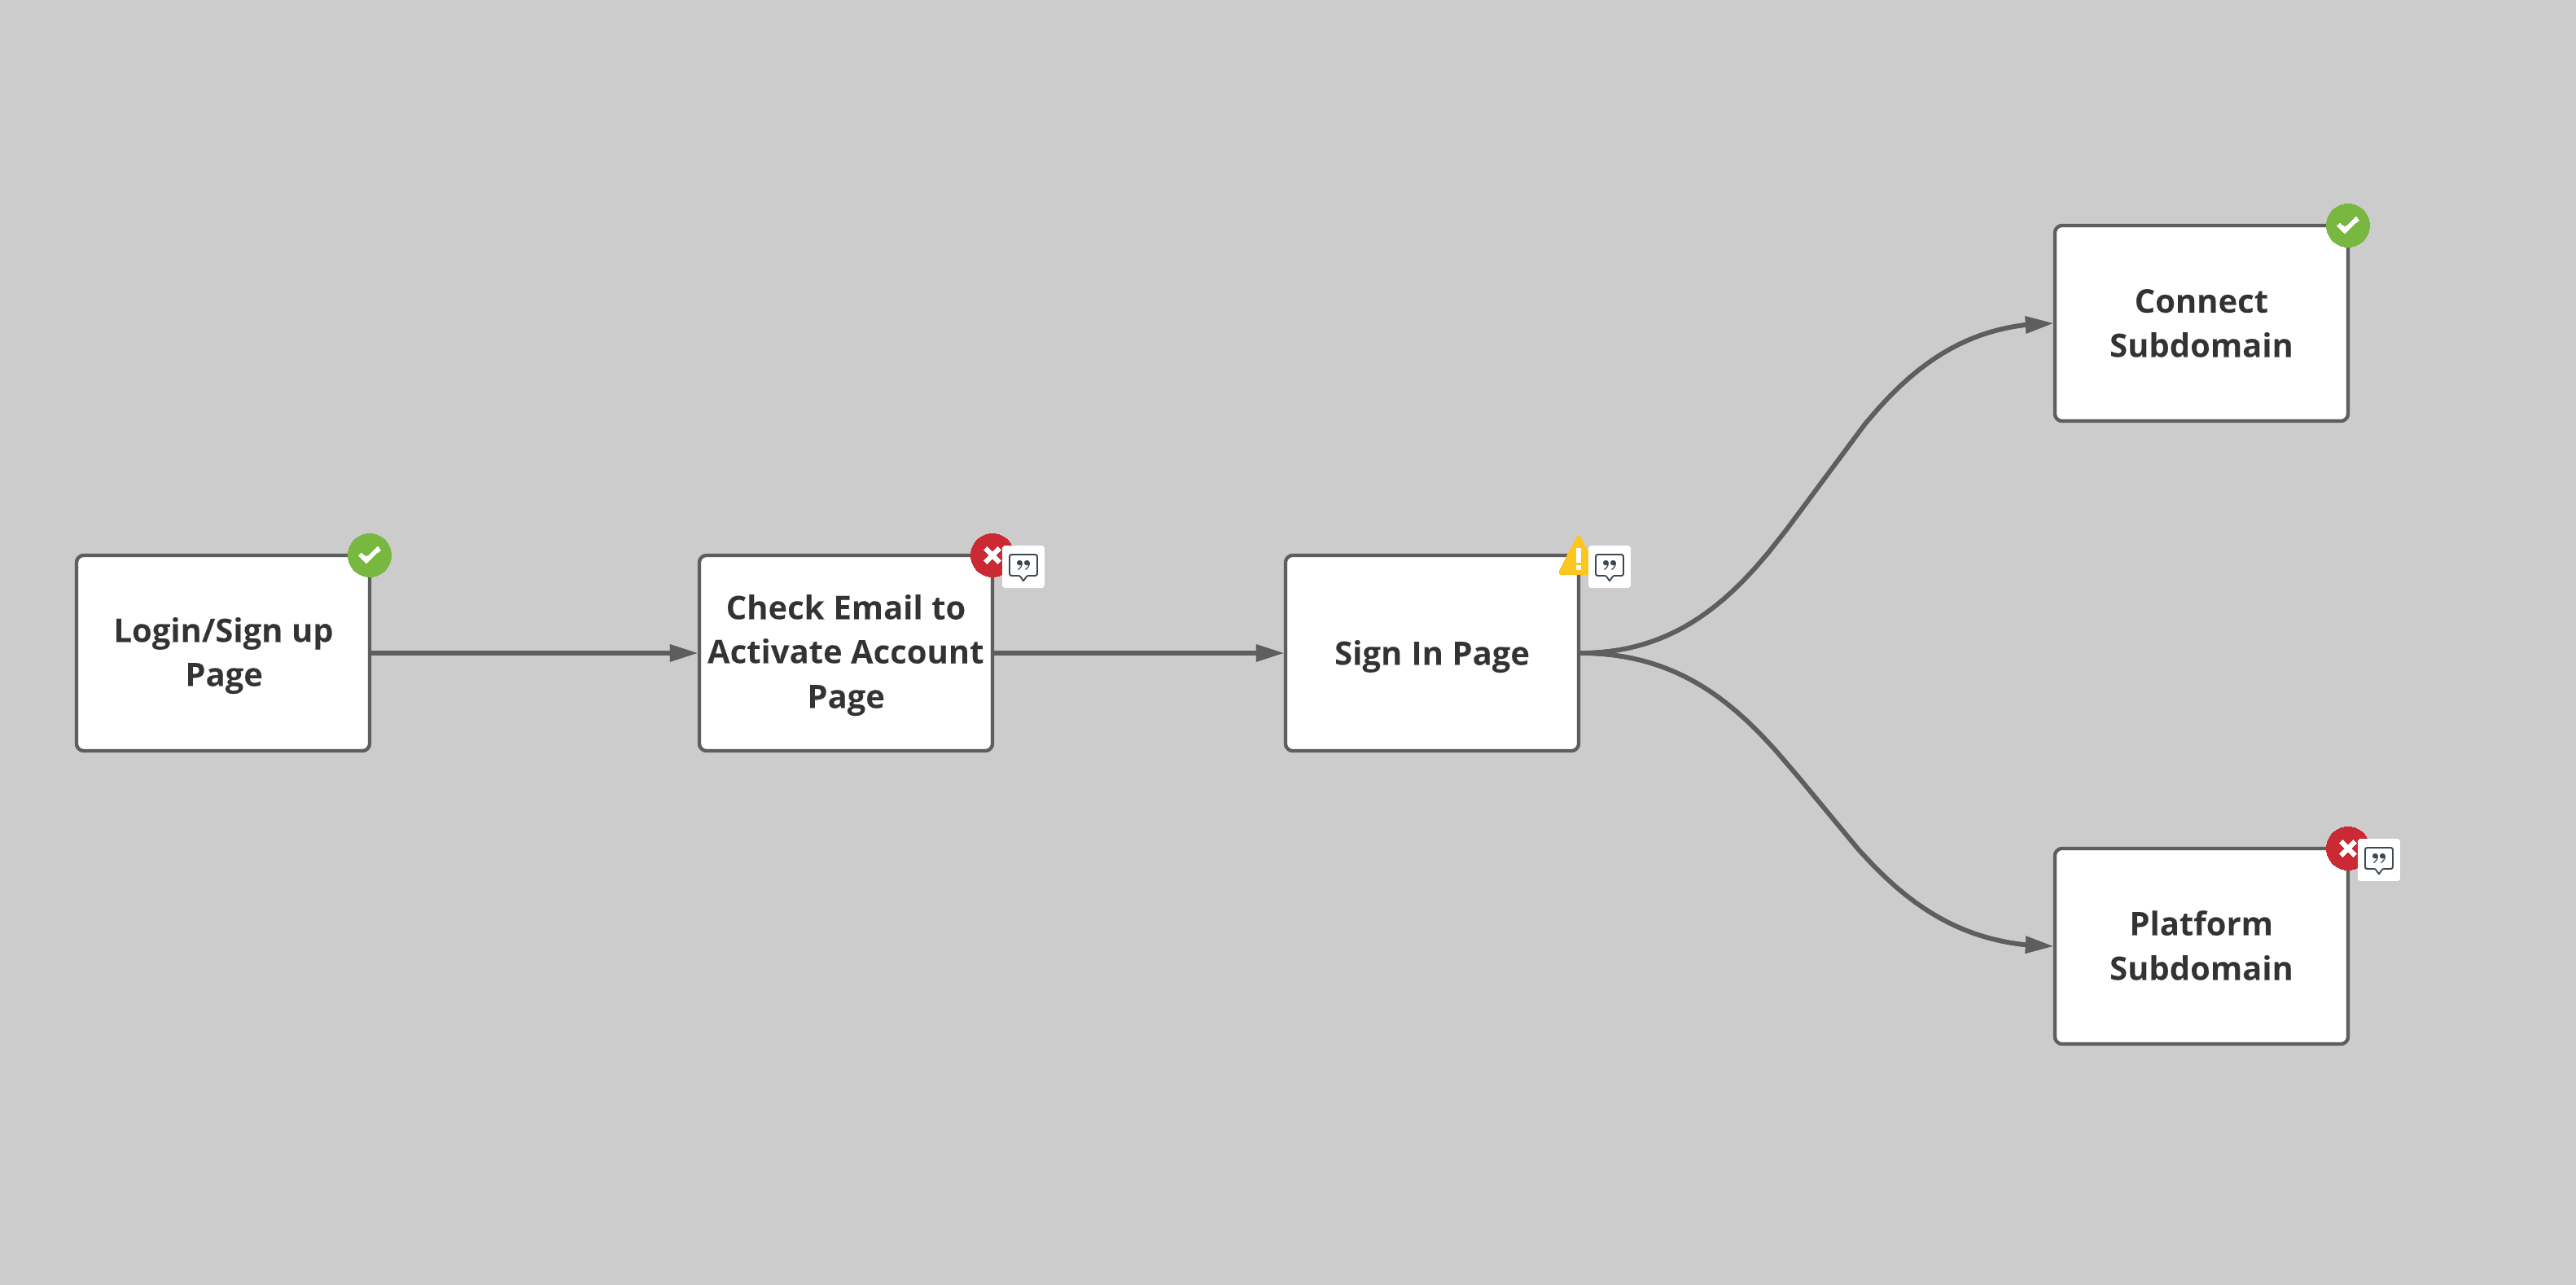
2. LucidChart for the win.
“If you fail to plan, plan to fail.”
After you are done identifying what are the main conversion paths users should be taking (if you are SaaS, this is quite the exercise and you most use content groups.), you need to document that down.
why?
you aren’t the only one that is going to be talking about funnels and user flows on the site.
And if we remember rule #1 – no assumptions are made.
if your planning stage goes wrong, your analytics will follow. This step is crucial and it’s one most people don’t spend enough time on.


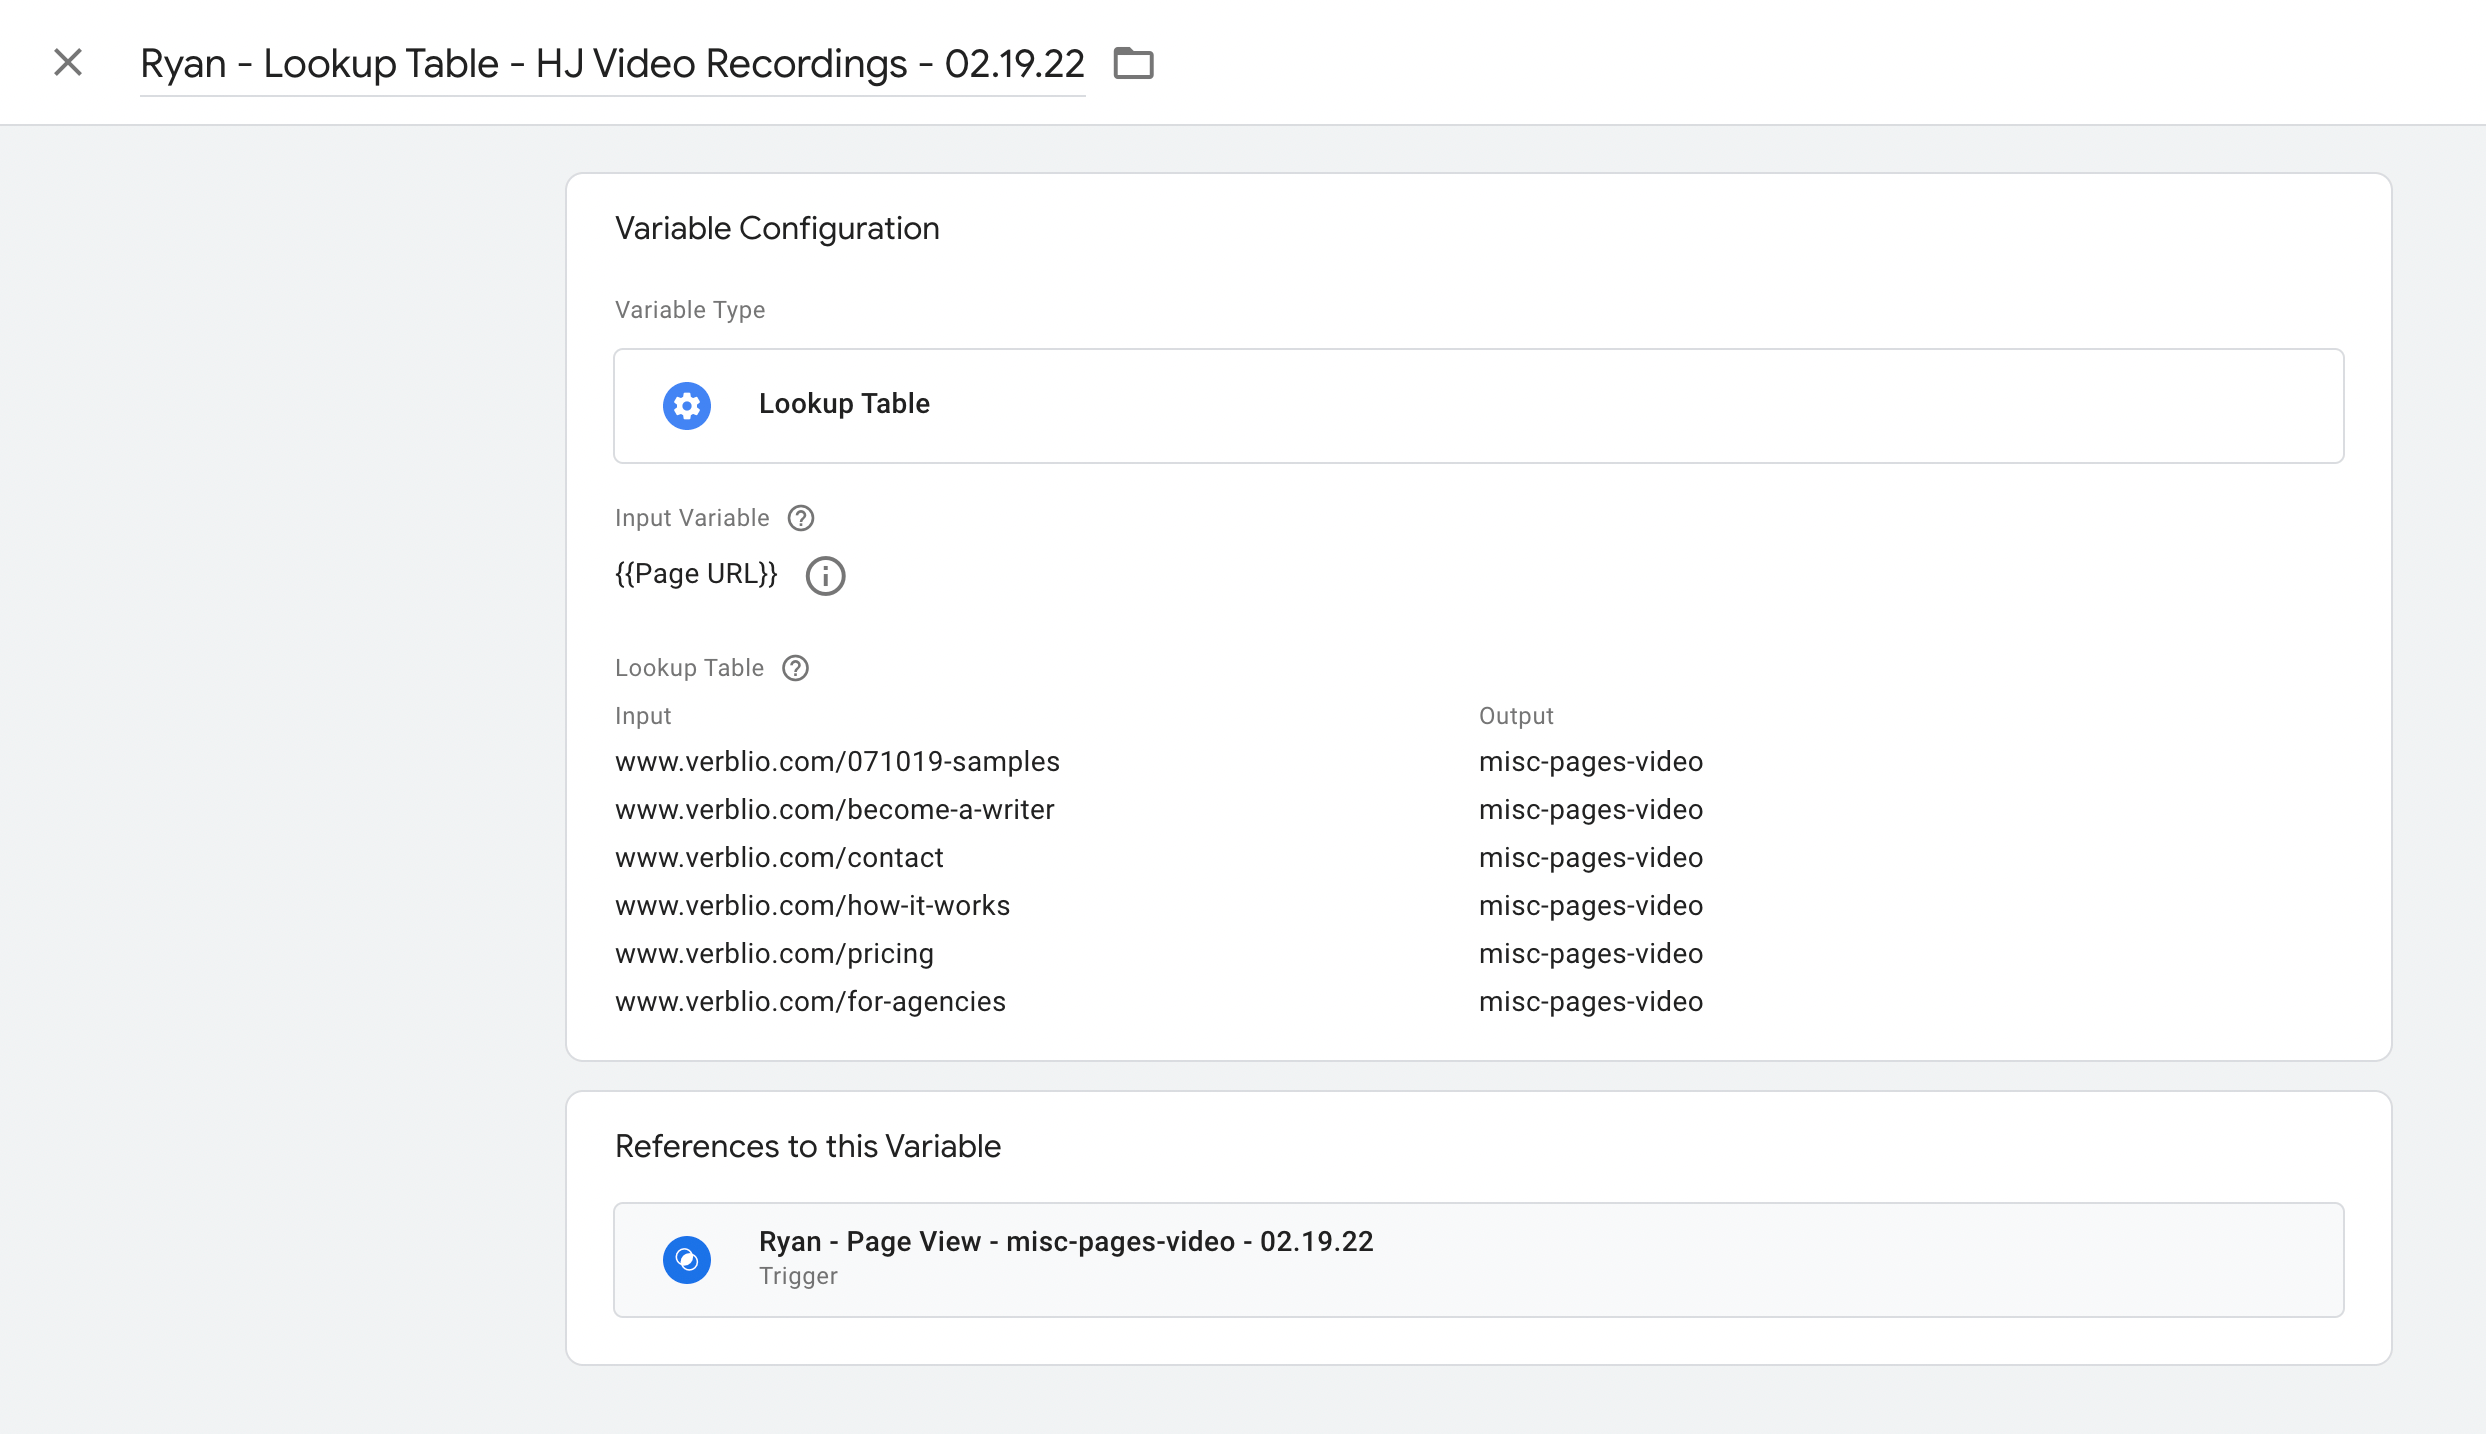
3. We all know what the real GTM stands for #trueNerds
4. The 4th step is GA 4. That's neat.
Not until the 4th step of the measurement marketing audit do we start to build more of the output.
And quite frankly, most of the “building” is done in GTM…but there are (more and more as GA 4 rolls out) settings to adjust and add in GA 4 to customize your reports.
and before you try and hate on GA 4 (you can hate all you want, we give you 101 reasons to love it), we aren’t even going to try and show you many reports there.
We’ll intro you to our friend, Google data studio next…


5. Google Data Studio. Your data story awaits.
last but definitely not least, this is where most of your data “reporting” should be happening.
Why?
you shouldn’t constantly be asking new questions every week 99% of businesses aren’t that complex.
besides, the best way to start seeing trends and patterns is by asking the same questions repeatedly.
“truth is in the trend, power is in the pattern” – mercer from measurementMarketing.io
GA should be used for ad hoc analysis, not for recurring Questions.
plus this will help you “market-forward” instead of constantly asking “how did we do?” type questions which are so reactive…you and your team need to evolve into expectations settings and predictions.
no better place to visualize and tell a story about all of this than GDS.


