Data Informed, Business Driven
We’re not one for keeping up with the trends just because, we keep up with them to give our clients only the best. “Data-driven” is a word we’ve all heard too much. Its almost lost its meaning because so many people have used it without really knowing what it meant. We like to say data informed, business driven. Measurement Marketing is another way to say that.
Prestige hired us to help them grow with math.
Here is how we did that…
Our Role
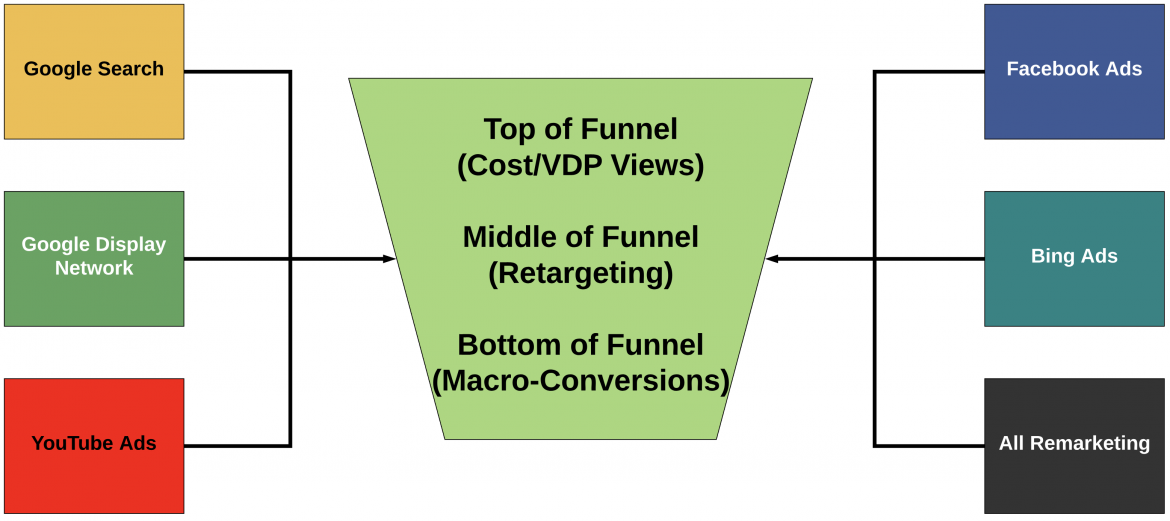
We had to start with the planning stage, which is always where we start. We sat down and figured out what the KPIs (Key Performance Indicators) were. We also figured out the micro-conversion that would lead up tot the macro ones as well. We mapped out several different user journeys to be able to track different parts of the funnel to see where they could be falling off at.
We built out an implementation plan with Data Governance in Google Tag Manager to protect Prestige’s intelligence, control vendors access points, and standardize Google Analytics Events to use across all vendors for apples to apples comparisons.
The reporting you will see with the Data Studio reports (which are actual live embeds), go ahead, change a date range and you will see ?
Lastly, we’ve built out an forecasting and optimization plan for Prestige in order to predict car sales every month and know where to optimize along the most common user journeys (which is why we took the time to map those in the planning stage).
Planning
Looking at what had been done initially in Google Analytics, mapping out user journeys, understanding the infrastructure their site was built on, etc.
Building
Google Analytics Audits, Google Tag Manager Implementation, Event Testing, etc.
Reporting
We don’t care about pretty, we care about actionable. We built a Data Studio report so it would provide useful truths for all who look at it.
Forecasting + Optimizing
The truth is in the trend the power is in the pattern. We have conditional triggers firing for when bounce rates rise to high in relation to events, for example. We use our marketing insights to trigger smart metrics and dimension triggers.
Actionable Dashboards
These dashboards are designed to answer questions and give the shareholders useful truths.
If you want to see the actual dashboards, feel free to check them out, here:


These dashboards definitely take awhile. As the saying goes in the data world, 90% of your time is spent cleaning, prepping, and formatting the data…
…and the other 10% of your time is spent complaining about doing that. ? We have an API setup now, so we only check for errors now and outliers, and spend the rest of our time analyzing.
Random Screenshots of the Data-Driven Process


The Bottom Line
Impressions
Averaged just above 19,000 more impressions per month, with same budget, with EC analyzing paid spend.
Conversions
We don’t just get more eyeballs on content, we get more leads for our clients and help their figure out customer acquisition costs
Funnel Tracking
We are our users falling off? Understanding individual step’s conversion rates is how you fix your core conversion rate
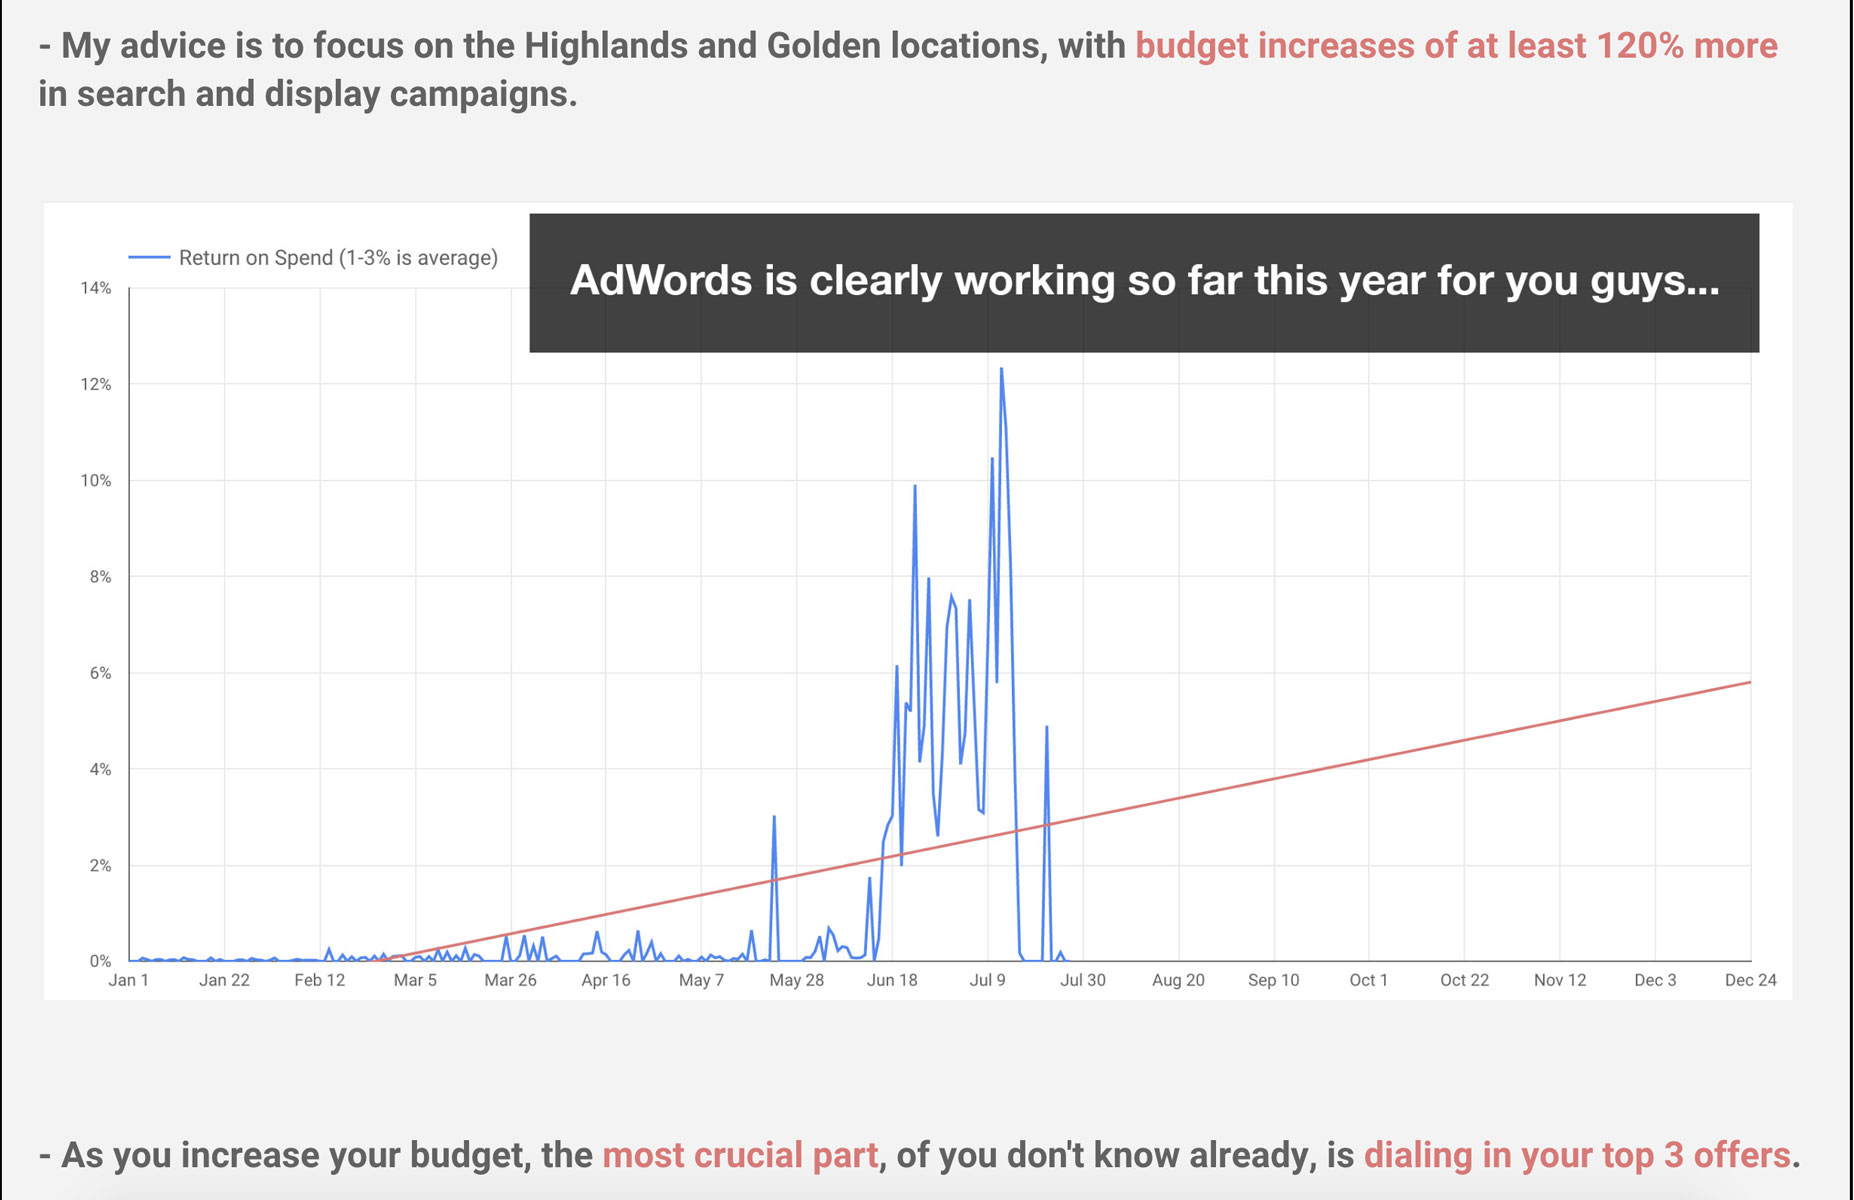
Record Sales Months
We’ve hit record sales months, every month, so far in 2018. We let the attributable results speak for themselves