When it comes to data visualization, Looker Studio has become the go-to tool for thousands of marketers and businesses.
But Looker Studio not only empowers users to visualize data but also performs some data transformations called data blending.
In this article, I’ll show you different ways to blend data with the various joint types: such as left, right, inner join, and outer join.
Data Blending: What is Data Blending?
Data blending is a process used in data analysis to combine data from multiple sources, often with different structures or data types, into a single, unified view.
This approach allows users to analyze and visualize relationships across various datasets, providing more comprehensive insights.
Data Blending Use Cases
- Combining fields from different platforms on a single chart eg cost from FB ad and Google Ad
- Combining fields from different accounts on a single chart
- Using fields from different data sources in a single calculated field eg calculating conversion rate
- Data enrichment eg looking up the population from a city
Comparison of the different join types in Looker Studio
| Join Type | Description | Usage |
| Inner Join | Returns rows where there is a match in both tables | Use it to retrieve data that exists in both tables and has a match. |
| Left Join | Returns all rows from the left table and the matched rows from the right table. If there is no match, NULL values are returned. | Use it when you want to retrieve all data from the left table but only match data from the right table. |
| Right Join | Returns all rows from the right table and the matched rows from the left table. If there is no match, NULL values are returned. | Use it when you want to retrieve all data from the right table but only match data from the left table. |
| Outer Join | Returns all rows when a match is in the left or right table. If there is no match, NULL values are returned. | Use it when you want to retrieve data from both tables, regardless of whether there is a match. |
Join Types in Looker Studio
There are 4 main join types in Looker Studio giving you the freedom to mix and match data from different tables. They are:
Left join
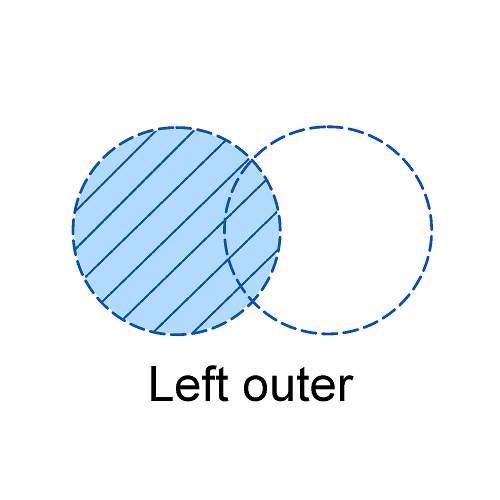
A left join is a type of join in Looker Studio that combines data from two tables based on a common key. The result includes all the records from the left table and the matching records from the right table.
If there’s no match in the right table, the result will display null values for the right table’s columns.
Right join
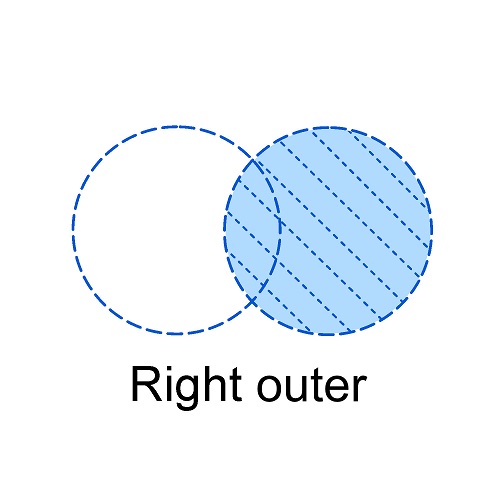
A right join, also known as a right outer join, is a type of join operation used in SQL databases, including Looker Studio. It combines data from two tables based on a common column, returning all the rows from the right table and matching rows from the left table.
If no match is found for a row in the right table, NULL values are displayed for the left table columns.
Inner join
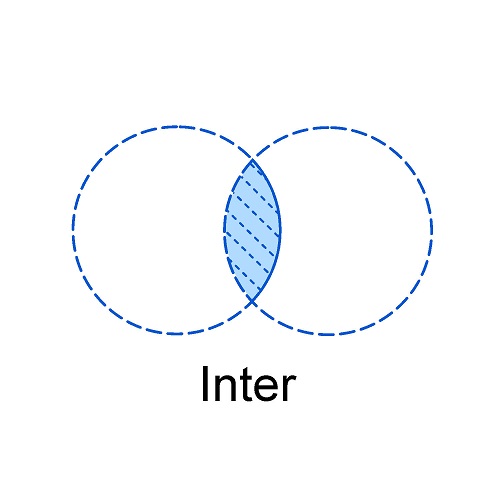
An inner join is a type of join that returns records from both tables only when there is a match between the specified columns.
In other words, it combines rows from two or more tables based on a shared field value, resulting in a new table that only displays records with matching values in the joined columns.
Use an inner join when you want to analyze data from multiple tables, but only need the records that share common values in the specified columns.
This join type is useful for filtering out unrelated records and focusing on the overlapping data between tables.
Outer join
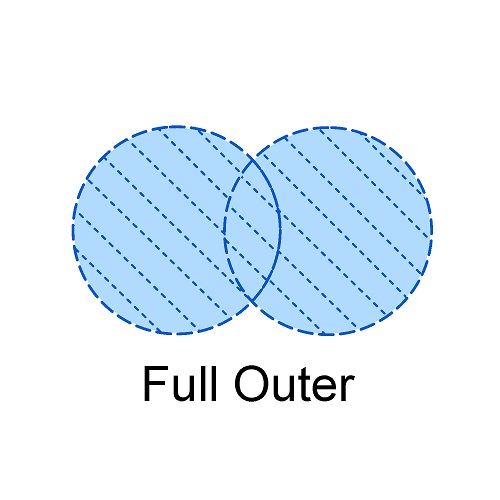
An outer join is a type of join that combines the results of two tables in a way that includes unmatched rows from one or both tables.There are two types of outer joins: full outer join and partial outer join. A full outer join returns all rows from both tables, whereas a partial outer join (left or right) includes unmatched rows from one of the tables.
This can be particularly useful when you want to retain information from both tables, even if there is no direct relationship between the data.
How to Blend Data in Looker Studio
Let’s walk through the steps to blend data in Looker Studio:
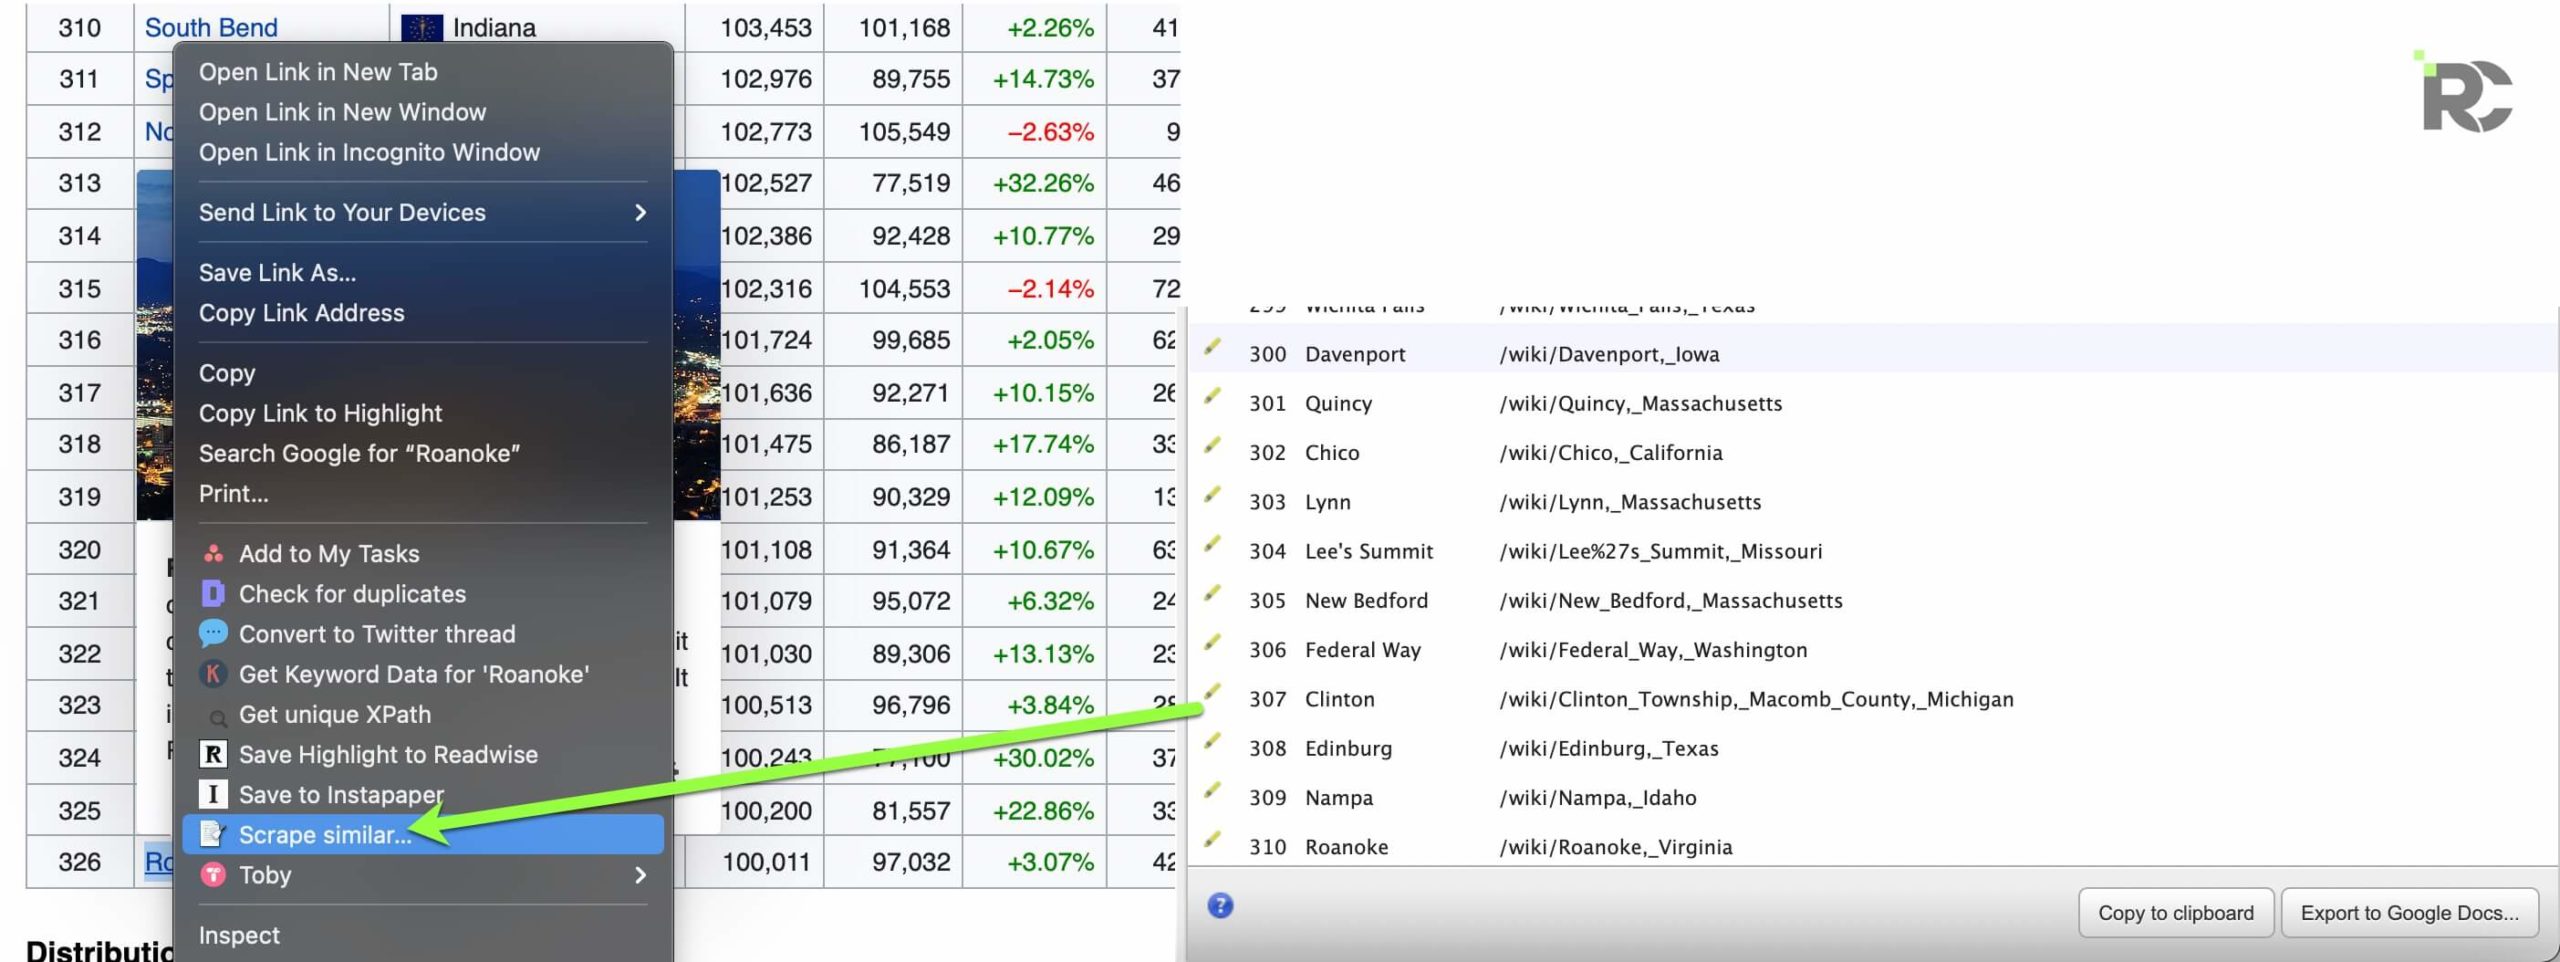
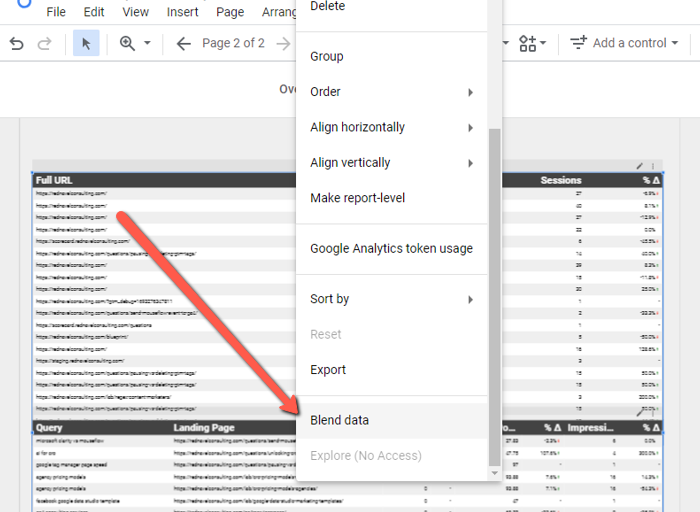
Step 1: Select the charts you need to work on and right-click to bring up the Blend Data Option.
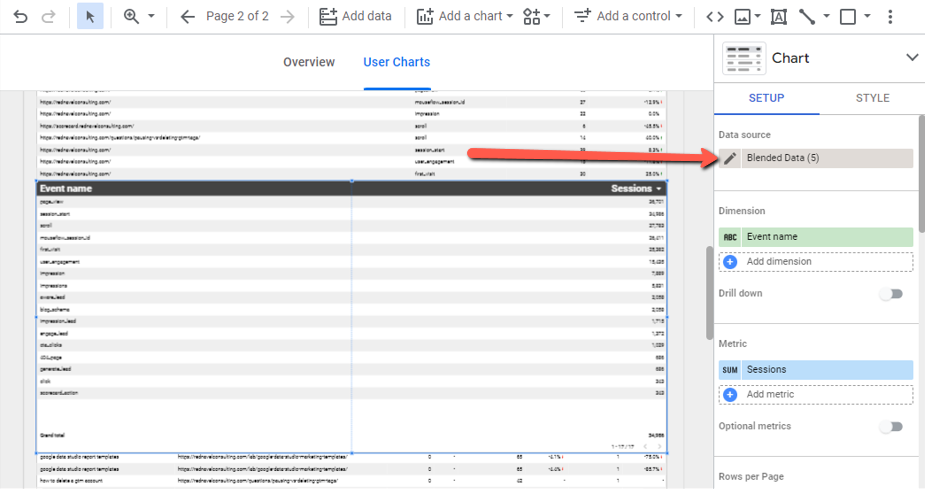
Step 2: Click on the new “Blended Data” to create a join between the tables
Step 3: Click to bring up the different join options available. Select the type of join you want to use
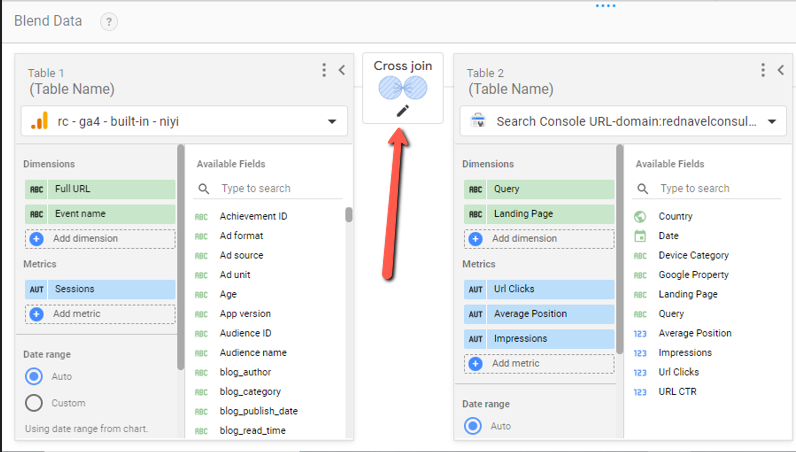
Step 4: Rename your data source so you can easily identify it.
Limitation of Data Blending in Looker Studio
Looker Studio is definitely an invaluable tool platform to blend and analyze data from various sources. However, it’s important to be aware of certain limitations that can impact your data blending endeavors.
1. Slower Performance Due to Data Blending:
While data blending is a powerful feature, it can potentially impact the performance of Looker Studio. Blending data from multiple sources involves complex computations and data-matching processes, which may lead to increased query execution times. As a result, users might experience slower response times when generating reports or visualizations that involve blended data.
2. Potential Inaccuracy in Blended Data:
Blending data from diverse sources can introduce discrepancies and inaccuracies, especially when dealing with varying data quality and definitions. Mismatches in keys, data inconsistencies, and discrepancies between datasets can lead to misleading insights and decisions.
3. Limitations on Data Sources and Dimensions:
Looker Studio imposes limits on the number of data sources and dimensions that can be used in a single analysis. Specifically, you can’t add more than five data sources and 10 dimensions from a single data source. This limitation can restrict the complexity and depth of analysis that you can achieve within a single report.
4. Data Range Filter Compatibility:
Data range filters, which allow users to select a specific date range for analysis, might not work seamlessly with all types of chart visualizations in Looker Studio. Certain chart types may not properly respond to date range filters, potentially leading to unexpected results.
Conclusion:
Looker Studio data blending gives new data transformation possibilities. This flexibility means you can now match and mix different data between tables. To provide new insight that can be used in your marketing and business insights.